heatmap.fm connects to Spotify and turns your top 100 artists into interactive geographic, temporal, and genre visualizations — shareable with anyone.
heatmap.fm is a full-stack music visualization web app that authenticates with Spotify and fetches your top 100 artists across three time windows (last 4 weeks, 6 months, or all-time). It enriches each artist with geographic and historical metadata, then renders three distinct interactive visualizations.
No account creation. No permanent data storage. Sessions live in Redis for one hour — after that, everything is gone. Share links expire after 30 days.
Each visualization is powered by a different library and tells a different story about your listening habits.
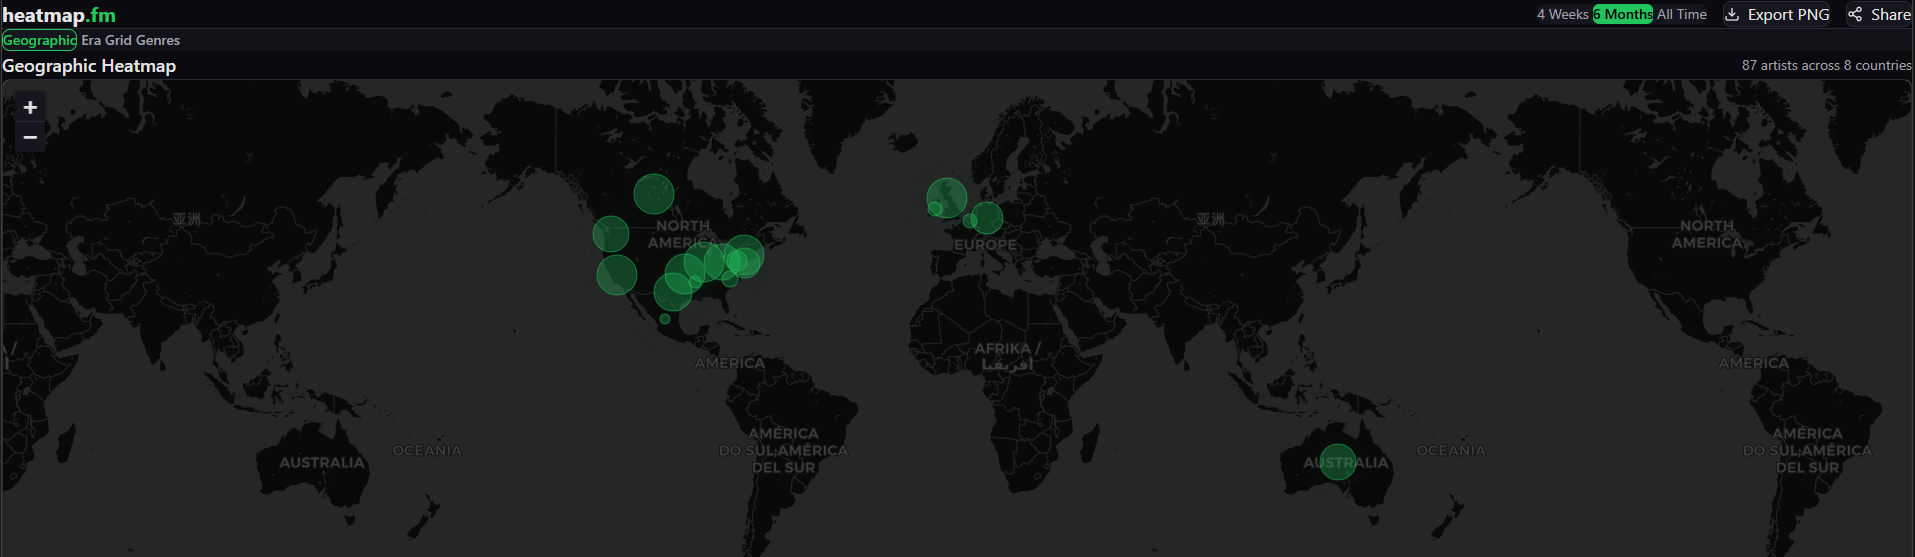
An interactive world map (Leaflet + CARTO dark tiles) overlaid with a green heat gradient. US artists are pinpointed at the state level — not just "somewhere in America." Circle markers group artists by region; clicking one reveals the top artists from that location.
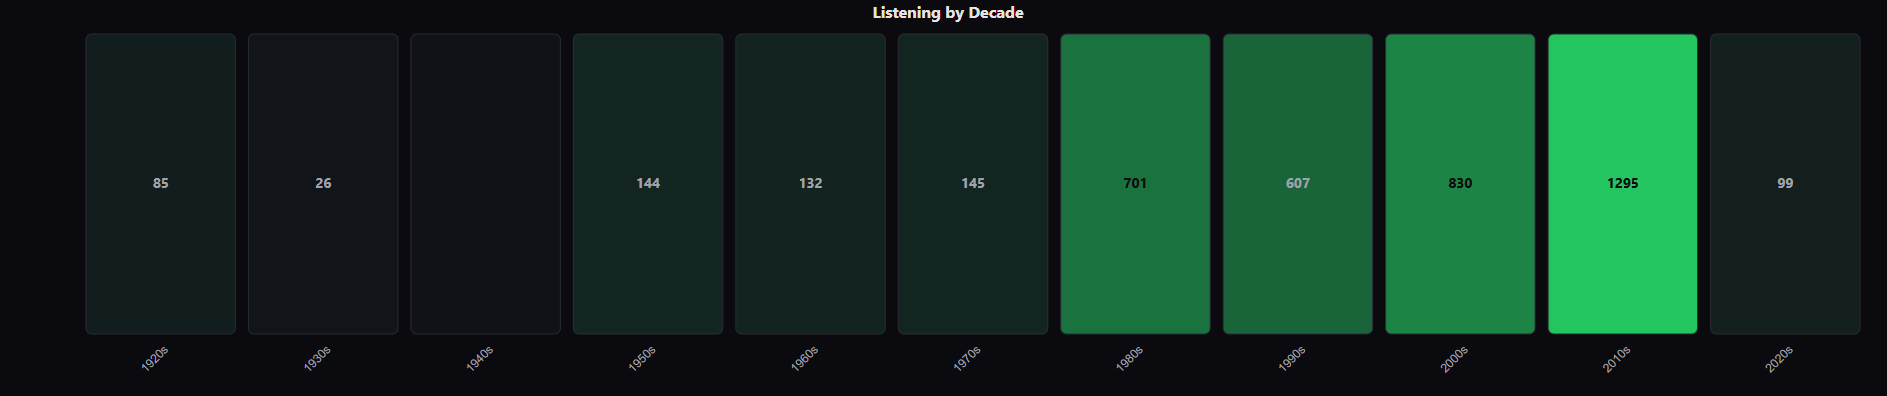
A D3.js bar grid spanning the 1920s through 2020s. Each decade cell is shaded from near-black to bright green based on how many plays come from artists who emerged in that era. Hovering a cell shows the top 3 artists from that decade.
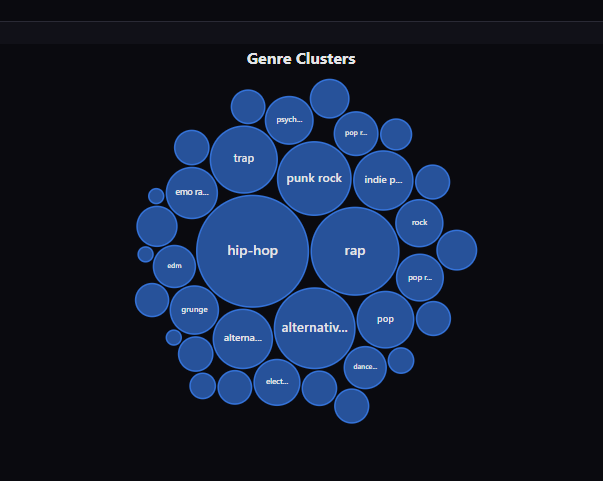
A D3 circle-packing layout rendering your top 40 genres as bubbles. Bubble size reflects listening intensity; bubble color represents the dominant continent of origin for that genre's artists — so listeners with mostly North American artists will see mostly blue bubbles. Hovering shows the genre's region and sample artists.
Generate an 8-character short link that lets anyone view your visualization — no login required. Links expire after 30 days via Redis TTL.
Export any visualization as a high-DPI PNG using html2canvas. Filenames include a timestamp to prevent overwrites.
Switch between last 4 weeks, 6 months, or all-time — all three visualizations update instantly from the same dataset.
No user database, no email, no passwords. Your Spotify token lives in Redis for one hour and is then gone permanently.
A stateless full-stack pipeline — no permanent database, no user accounts.
The user clicks "Connect with Spotify." The backend generates a cryptographic code verifier, hashes it into a code challenge (SHA-256 → base64url), and stores the verifier in Redis with a 10-minute TTL. The user is redirected to Spotify's authorization screen. On callback, the code is exchanged for tokens — the verifier proves the request is legitimate, even without exposing the client secret.
After token exchange, the backend generates a random 32-char session ID and stores
{ access_token, refresh_token, expires_at }
in Redis with a 1-hour TTL. The session ID is passed to the frontend via query param,
saved to localStorage,
and sent with every subsequent request as an X-Session-ID header.
Two parallel requests hit Spotify's /me/top/artists
endpoint (offset 0 and offset 50, 50 artists each) using
Promise.all.
Results are merged and assigned a relative play_count rank (position 1 = 100 points, position 100 = 1 point).
For each artist, the backend checks a static JSON cache first (O(1), ~200 artists pre-mapped).
On a cache miss, it queries the MusicBrainz API — throttled to exactly 1 request per 1.1 seconds
using p-throttle to respect their
API policy. MusicBrainz returns iso-3166-1-codes
(country) and iso-3166-2-codes (US state).
Coordinates are looked up from bundled JSON files and merged onto the artist object.
The enriched artist array is returned to the React frontend. Each visualization component receives the same data prop and independently filters, aggregates, and renders using D3.js (Era Grid, Genre Bubbles) or Leaflet (Geographic Heatmap). Switching views is instant — no additional network requests.
Clicking Share serializes the current artist array + active view to Redis with an
8-character nanoid key and a 30-day TTL. The resulting URL is copied to the clipboard.
Anyone visiting the share link loads the data without authenticating.
Export uses html2canvas
at 2x render scale to capture the live DOM element and trigger a browser PNG download.
Implements the full PKCE flow from scratch — generating a random code verifier, deriving a SHA-256 challenge, and validating both sides of the exchange. The client secret never touches the browser. State tokens prevent CSRF attacks.
Spotify's API caps at 50 artists per request. To get 100, two requests are fired
in parallel using Promise.all, then merged
— halving the wait time vs. sequential fetching.
A static JSON cache handles most artists instantly (O(1)). Cache misses fall back
to a live MusicBrainz query, throttled to 1 req/sec. Each artist gets lat/lng,
a decade label, and a geo_source tag for traceability.
US artists resolve to their home state centroid (e.g., California, Tennessee, New York) using ISO 3166-2 codes from MusicBrainz, rather than collapsing 90+ artists onto a single pin at the US geographic center.
No SQL database. Sessions, auth state, and share data all live in Upstash Redis with explicit TTLs. If Redis is unavailable, an in-memory fallback Map keeps the app running in development.
The API is protected by express-rate-limit
at 30 requests/minute per IP. MusicBrainz calls are separately throttled to exactly
1 request per 1.1 seconds with p-throttle
to satisfy their API policy and avoid bans.
Three visualizations, two libraries. D3's pack/scale APIs power the Era Grid (band scale + sequential color) and Genre Bubbles (circle packing). Leaflet handles the interactive tile map with a custom heat layer and dynamic circle markers.
Any visualization can be shared via a public 8-char link (no login needed for viewers)
or downloaded as a 2x scale PNG using html2canvas
capturing the live DOM. Both features work on all three visualizations.